1
2
3
4
5
6
7
8
9
10
11
12
13
14
15
16
17
18
19
20
21
22
23
24
25
26
27
28
29
30
31
32
33
34
35
36
37
38
39
40
41
42
43
44
45
46
47
48
49
50
51
52
53
54
55
56
57
58
59
60
61
62
63
64
65
66
67
68
69
70
71
72
73
74
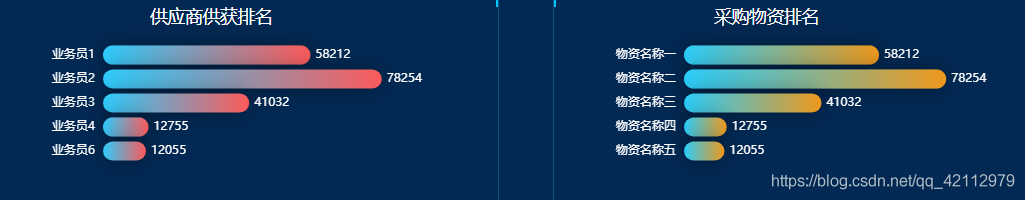
| <div id="rtleft" style="float: left;height: 100%;width: 420px;margin-left: 20px;margin-top: -50px;"></div>
<!--右上靠左-->
<script type="text/javascript">
var myChart = echarts.init(document.getElementById('rtleft'));
var option = {
dataset: {
source: [
['score', 'amount', 'product'],
[89.3, 58212, '业务员1'],
[57.1, 78254, '业务员2'],
[74.4, 41032, '业务员3'],
[50.1, 12755, '业务员4'],
[52.1, 12055, '业务员6'],
]},
grid: {containLabel: true},
xAxis: {name: 'amount',
show:false},
yAxis: {
inverse:true,
type: 'category',
axisLine:{
show:false,
},
axisTick: {
show: false,
},
axisLabel: {
show: true,
textStyle: {
color:'#fff'
}
},
},
series: [{
type: 'bar',
encode: {
x: 'amount',
y: 'product'
},
itemStyle: {
normal: {
barBorderRadius: 20,
color: new echarts.graphic.LinearGradient(0, 0, 1, 0, [{
offset: 0,
color: '#2cccfd'
}, {
offset: 1,
color: '#fc5a5a'
}]),
shadowColor: 'rgba(0, 0, 0, 0.4)',
shadowBlur: 20
},
},
label: {
show: true,
position: 'right',
textStyle: {
color: '#fff',
fontSize: '12'
}
},
}]
};
myChart.setOption(option);
</script>
|